

$ tar -xzvf slowhttptest-x.x.tar.gz

$ cd slowhttptest-x.x

$ ./configure --prefix=PREFIX

$ make

$ sudo make install
svn checkout http://slowhttptest.googlecode.com/svn/trunk/ slowhttptest-read-only
$ PREFIX/bin/slowhttptest
| test type | SLOW HEADERS |
| number of connections | 50 |
| URL | http://localhost/ |
| verb | GET |
| interval between follow up data | 10 seconds |
| connections per second | 50 |
| test duration | 240 seconds |
| probe connection timeout | 5 seconds |
| max length of followup data field | 32 bytes |
GET / HTTP/1.1
Host: localhost:80
User-Agent: Mozilla/4.0 (compatible; MSIE 8.0; Windows NT 6.1; Trident/4.0; SLCC2)
X-HMzV2bwpzQw9jU9fGjIJyZRknd7Sa54J: u6RrIoLRrte4QV92yojeewiuDa9BL2N7.
. 10 seconds.
X-nq0HRGnv1W: T5dSL.
. 10 seconds.
X-iFrjuN: PdR7Jcj27P
.
.
| -a start | start value of ranges-specifier for range header test |
| -b bytes | limit of range-specifier for range header test |
| -c number of connections | limited to 1024 |
| -H, B, R or X | specify to slow down in headers section or in message body, -R enables range test, -X enables slow read test |
| -g | generate statistics in CSV and HTML formats, pattern is slow_xxx.csv/html, where xxx is the time and date |
| -i seconds | interval between follow up data in seconds, per connection |
| -k pipeline factor | number of times to repeat the request in the same connection for slow read test if server supports HTTP pipe-lining. |
| -l seconds | test duration in seconds |
| -n seconds | interval between read operations from receive buffer |
| -o file | custom output file path and/or name, effective if -g is specified |
| -p seconds | timeout to wait for HTTP response on probe connection, after which server is considered inaccessible |
| -r connections per second | connection rate |
| -s bytes | value of Content-Length header, if -B specified |
| -t verb | custom verb to use |
| -u URL | target URL, the same format you type in browser, e.g https://host[:port]/ |
| -v level | verbosity level of log 0-4 |
| -w bytes | start of range the advertised window size would be picked from |
| -x bytes | max length of follow up data |
| -y bytes | end of range the advertised window size would be picked from |
| -z bytes | bytes to read from receive buffer with single read() operation |
./slowhttptest -c 1000 -B -g -o my_body_stats -i 110 -r 200 -s 8192 -t FAKEVERB -u https://myseceureserver/resources/loginform.html -x 10 -p 3
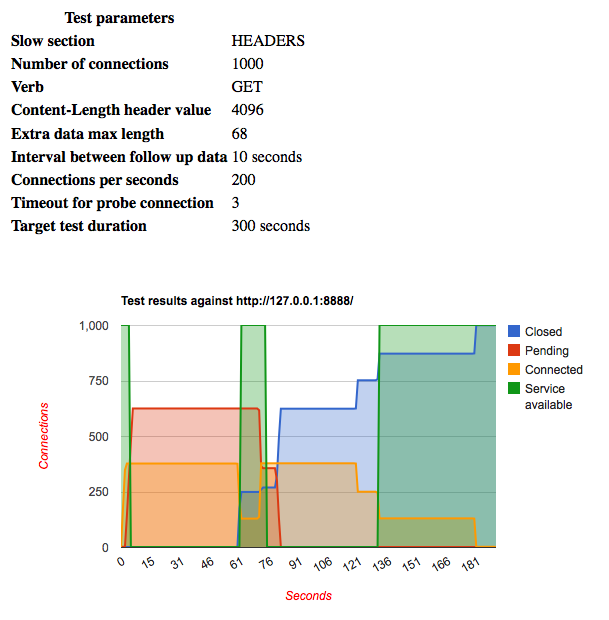
./slowhttptest -c 1000 -H -g -o my_header_stats -i 10 -r 200 -t GET -u https://myseceureserver/resources/index.html -x 24 -p 3
| For desktop users, monitoring resource usage is an important task. By doing this, we can locate system bottleneck, planning what to do to optimize our system, identifying memory leak and so on. The problem is, which software one should use and how to use it according to our need. | ||||||||||||||||||||||||||||||||||||||
| Among many monitoring tools that available, most people use "top" (a part of procps package). Top provide almost everything we need to monitor our system's resource usage within single shot. In this article, all the information are based on procps 3.2.5 running on top of Linux kernel 2.6.x Here, we assume that procps package is already installed and run well in your Linux system. No previous experience with top is needed here, but if you had given it a try briefly, that would be an advantage. Here are some challenges: A. Interactive or batch mode?By default, top is invoked using interactive mode. In this mode, top runs indefinitely and accepts keypress to redefine how top works. But, sometimes you need to post-process the top's output and this is hardly achieved using this mode. The solution? Use batch mode.$ top -b You will get output like below: top - 15:22:45 up 4:19, 5 users, load average: 0.00, 0.03, 0.00 Tasks: 60 total, 1 running, 59 sleeping, 0 stopped, 0 zombie Cpu(s): 3.8% us, 2.9% sy, 0.0% ni, 89.6% id, 3.3% wa, 0.4% hi, 0.0% si Mem: 515896k total, 495572k used, 20324k free, 13936k buffers Swap: 909676k total, 4k used, 909672k free, 377608k cached PID USER PR NI VIRT RES SHR S %CPU %MEM TIME+ COMMAND 1 root 16 0 1544 476 404 S 0.0 0.1 0:01.35 init 2 root 34 19 0 0 0 S 0.0 0.0 0:00.02 ksoftirqd/0 3 root 10 -5 0 0 0 S 0.0 0.0 0:00.11 events/0Uh, wait, it runs repeatedly, just like interactive mode does. Don't worry, limit its repetition with -n. So, if you just want single shot, type: $ top -b -n 1The real advantage of this mode is you can easily combine in with at or cron. Together, top can snapshot resource usage at certain time unattendedly. For example, using at, we can schedule top to run 1 minute later. $ cat ./test.at TERM=linux top -b -n 1 >/tmp/top-report.txt $ at -f ./test.at now+1minutesCareful reader might ask "why do I need to set TERM environment before invoking top when creating new at job?". The answer is, top needs this variable set but unfortunately "at" isn't retained it from the time of invocation. Simply set it like above and top will work smoothly. B. How to monitor certain processes only?Sometimes, we are only interested on several processes only, maybe just 4 or 5 of the whole existing processes. For example, if you want monitor process identifier (PID) 4360 and 4358, you type:$ top -p 4360,4358OR $ top -p 4360 -p 4358Seems easy, just use -p and list all the PIDs you need, each separated with comma or simply use -p multiple times coupled with the target PID. Another possibility is just monitoring process with certain user identifier (UID). For this need, you can use -u or -U option. Assuming user "johndoe" has UID 500, you can type: $ top -u johndoeOR $ top -u 500OR $ top -U johndoeThe conclusion is, you can either use the plain user name or the numeric UID. "-u, -U? Those two are different?" Yes. Like almost any other GNU tools, options are case sensitive. -U means top will find matching effective, real, saved and filesystem UIDs, while -u just find matching effective user id. Just for reminder, every *nix process runs using effective UID and sometimes it isn't equal with real user ID. Most likely, one is interested in effective UID as filesystem permission and operating system capability are checked against it, not real UID. While -p is just command-line option only, both -U and -u can be used inside interactive mode. Like you guess, press 'U' or 'u' to filter the processes based on their user name. Same rule is applied, 'u' for effective UID and 'U' for real/effective/saved/filesystem user name. You will be asked to enter the user name or the numeric UID. {mospagebreak title=Fast or slow update?} C. Fast or slow update?Before we answer this question, let's take a short look on how top really works. Strace is your friend here:$ strace -o /tmp/trace.txt top -b -n 1Use you favourite text editor and load /tmp/trace.txt. What do you think? A lot of jobs for single invocation, that is what I think and maybe you'll agree. One of the jobs top must do in every iteration is opening many files and parsing their contents, as shown by the number: $ grep open( /tmp/hasil.txt | wc -lJust for illustration, in my Linux system, it yields 304. Closer look reveals that top iterates inside /proc directory to gather processes information. /proc itself is pseudo filesystem, meaning it doesn't exist on real disk but is created on the fly by the Linux kernel and live on RAM. Within directory such as /proc/2097 (2097 is a PID), Linux kernel exports information about related process and this is where top gathers processes information along with resource usage. Also try these: $ time top -b -n 1This will give you illustration how fast top works on single round. In my system, this yields around 0.5-0.6 seconds. Look at "real" field, not the "user" or "system" field because "real" reflects the total time top needs to work. So, realizing this fact, it will be wise to use moderate update interval. Browsing RAM based filesystem takes time too, so be wise. As rule of thumb, 1 to 3 seconds interval is enough for most users. Use -d in command line option or press "s" inside interactive mode to set it. You can use fractional number as interval, e.g: 2.5, 4.1 and so on When we should faster than 1 seconds? Of course, whenever you need to force the update, just press Space and top will refresh the statistic right away. {mospagebreak title=Fields we need} D. Fields that we needBy default, top starts by showing the following task's property:
Sorting use similar way. Press 'O' (upper case) followed by a key representing the field. Don't worry if you don't remember the key map, top will show it. The new sort key will be marked with asterisk and the letter will change to upper case, so you can notice it easily. Press Enter after you are finished {mospagebreak title=Multi view are better than one?} E. Multi view are better than one?In different situations, sometimes we want to monitor different system property. For example, at one time you want to monitor %CPU and cpu time spent by all tasks. At another time, you want to monitor resident size and total page faults of all tasks. Rapidly press 'f' and change the visible fields? I don't think this is a smart choice.Why don't you use Multiple Windows mode? Press 'A' (upper case) to switch to multi windows view. By default, you will see 4 different set of field groups. Each field groups has a default label/name:
 1st field group is the usual group you see in single window view, while the rest are hidden. Inside multi window mode, press 'a' or 'w' to cycle through all the available windows. Pay attention, switching to another window also change the active window (also known as current window). If you are not sure which one is currently the active one, just look at the first line of top's display (at the left of current time field). Another way to change active window is by pressing 'G' followed by windows number (1 to 4). 1st field group is the usual group you see in single window view, while the rest are hidden. Inside multi window mode, press 'a' or 'w' to cycle through all the available windows. Pay attention, switching to another window also change the active window (also known as current window). If you are not sure which one is currently the active one, just look at the first line of top's display (at the left of current time field). Another way to change active window is by pressing 'G' followed by windows number (1 to 4).Active window is the one which react to user input, so make sure to select your preferred window first before doing anything. After that, you can do anything exactly like you do in single window mode. Usually, what you want to do here is customizing field display, so just press 'f' and start customizing. If you think 4 is too much, just switch to a field group and press '-' to hide it. Please note, even you hide current field group, that doesn't mean you also change the active group. Press '-' once again to make current group visible. If you are done with multi window mode, press 'A' again. That also make active group as the new field group of single window mode. F. "How come there is only so few free memory on my Linux PC?"Come to same question? No matter how much you put RAM in your motherboard, you quickly notice the free RAM is reduced so fast. Free RAM miscalculation? No!Before answering this, first check the memory summary located on the upper side of top's display (you may need to press 'm' to unhide it). There, you will find two fields: buffers and cached. "Buffers" represent how much portion of RAM is dedicated to cache disk block. "Cached" is similar like "Buffers", only this time it caches pages from file reading. For thorough understanding of those terms, refer to Linux kernel book like Linux Kernel Development by Robert M. Love. It is enough to understand that both "buffers" and "Cached" repre- sent the size of system cache. They dynamically grow or shrink as requested by internal Linux kernel mechanism. Besides consumed by cache, the RAM itself is also occupied by application data and code. So, to conclude, free RAM size here means RAM area that isn't occupied by cache nor application data/code. Generally, you can consider cache area as another "free" RAM since it will be shrunk gradually if the application demands more memory. On the task point of view, you might wonder which field truly represent memory consumption. VIRT field? certainly not! Recall that this field represent everything inside task address space, including the related shared libraries. After reading top source code and proc.txt (inside Documentation/filesystem folder of kernel source's tree), I conclude that RSS field is the best field describing task's memory consumption. I said "best" because you should consider it as approximation and isn't 100% accurate on all time. G. Working with many saved configurationsWanna keep several different configuration of top so you can easily switch between preconfigured display? Just create symbolic link to the top binary (name it anything you like:# ln -s /usr/bin/top /usr/bin/top-aThen run the new "top-a". Do the tweak and press 'W' to save the configuration. It will be saved under ~/.top-arc (the format is your top alias name+'rc'). Now run the original top to load your first display alternative, top-a for the second one and so on. {mospagebreak title=Conclusion} H. ConclusionThere are numerous tricks to use top more efficiently. The key is by knowing what you really need and possibly a little good understanding of Linux low level mechanism. The statistics isn't always correct, but at least it is helpful as a overall measurement. All these numbers are gathered from /proc, so make sure it is mounted first!Reference:
|